
Search for Indicators
Community Spending Dashboard
Indicator Gauge Icon Legend
Legend Colors
Red is bad, green is good, blue is not statistically different/neutral.
Compared to Distribution
 the value is in the best half of communities.
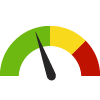
 the value is in the 2nd worst quarter of communities.
 the value is in the worst quarter of communities.
Compared to Target
 meets target;
  does not meet target.
Compared to a Single Value
 lower than the comparison value;
 higher than the comparison value;
 not statistically different from comparison value.
Trend

 non-significant change over time;
 significant change over time;
  no change over time.
Compared to Prior Value
 higher than the previous measurement period;
 lower than the previous measurement period;
 no statistically different change from previous measurement period.
Parish: East Baton Rouge
Health / Health Care Access & Quality
Value
Compared to:
Parish: East Baton Rouge Community Spending on Health Care
Parish: East Baton Rouge Community Spending on Health Care
7.5%
(2024)
Compared to:

LA Value
(8.3%)
The regional value is compared to the Louisiana State value.
US Value
(8.0%)
The regional value is compared to the national value.
Prior Value
(7.5%)
Prior Value compares a measured value with the previously measured value. Confidence intervals were not taken into account in determining the direction of the comparison.
Parish: East Baton Rouge Health Insurance Spending-to-Income Ratio
Parish: East Baton Rouge Health Insurance Spending-to-Income Ratio
7.5%
(2024)
Compared to:


LA Parishes
The distribution is based on data from 64 Louisiana Parishes.
U.S. Counties
The distribution is based on data from 3,141 U.S. counties and county equivalents.
LA Value
(7.3%)
The regional value is compared to the Louisiana State value.
US Value
(6.1%)
The regional value is compared to the national value.
Prior Value
(6.7%)
Prior Value compares a measured value with the previously measured value. Confidence intervals were not taken into account in determining the direction of the comparison.
Parish: East Baton Rouge
Health / Older Adults
Value
Compared to:
Parish: East Baton Rouge Adult Day Care Spending-to-Income Ratio
Parish: East Baton Rouge Adult Day Care Spending-to-Income Ratio
18.3%
(2024)
Compared to:


LA Parishes
The distribution is based on data from 64 Louisiana Parishes.
U.S. Counties
The distribution is based on data from 3,141 U.S. counties and county equivalents.
LA Value
(16.2%)
The regional value is compared to the Louisiana State value.
US Value
(12.3%)
The regional value is compared to the national value.
Prior Value
(16.3%)
Prior Value compares a measured value with the previously measured value. Confidence intervals were not taken into account in determining the direction of the comparison.
Parish: East Baton Rouge
Health / Tobacco Use
Value
Compared to:
Parish: East Baton Rouge Cigarette Spending-to-Income Ratio
Parish: East Baton Rouge Cigarette Spending-to-Income Ratio
2.4%
(2024)
Compared to:


LA Parishes
The distribution is based on data from 64 Louisiana Parishes.
U.S. Counties
The distribution is based on data from 3,141 U.S. counties and county equivalents.
LA Value
(2.5%)
The regional value is compared to the Louisiana State value.
US Value
(1.9%)
The regional value is compared to the national value.
Prior Value
(2.1%)
Prior Value compares a measured value with the previously measured value. Confidence intervals were not taken into account in determining the direction of the comparison.
Parish: East Baton Rouge
Community / Transportation
Value
Compared to:
Parish: East Baton Rouge Community Spending on Transportation
Parish: East Baton Rouge Community Spending on Transportation
18.7%
(2024)
Compared to:

LA Value
(19.4%)
The regional value is compared to the Louisiana State value.
US Value
(17.4%)
The regional value is compared to the national value.
Prior Value
(18.7%)
Prior Value compares a measured value with the previously measured value. Confidence intervals were not taken into account in determining the direction of the comparison.
Parish: East Baton Rouge Gasoline and Other Fuels Spending-to-Income Ratio
Parish: East Baton Rouge Gasoline and Other Fuels Spending-to-Income Ratio
4.2%
(2024)
Compared to:

LA Parishes
The distribution is based on data from 64 Louisiana Parishes.
U.S. Counties
The distribution is based on data from 3,141 U.S. counties and county equivalents.
LA Value
(4.2%)
The regional value is compared to the Louisiana State value.
US Value
(3.2%)
The regional value is compared to the national value.
Prior Value
(3.8%)
Prior Value compares a measured value with the previously measured value. Confidence intervals were not taken into account in determining the direction of the comparison.
Parish: East Baton Rouge
Economy / Food Insecurity
Value
Compared to:
Parish: East Baton Rouge Community Spending on Food
Parish: East Baton Rouge Community Spending on Food
12.3%
(2024)
Compared to:
LA Value
(13.0%)
The regional value is compared to the Louisiana State value.
US Value
(12.6%)
The regional value is compared to the national value.
Prior Value
(12.3%)
Prior Value compares a measured value with the previously measured value. Confidence intervals were not taken into account in determining the direction of the comparison.
Parish: East Baton Rouge
Economy / Housing & Homes
Value
Compared to:
Parish: East Baton Rouge Community Spending on Housing
Parish: East Baton Rouge Community Spending on Housing
33.1%
(2024)
Compared to:
LA Value
(32.4%)
The regional value is compared to the Louisiana State value.
US Value
(32.1%)
The regional value is compared to the national value.
Prior Value
(33.1%)
Prior Value compares a measured value with the previously measured value. Confidence intervals were not taken into account in determining the direction of the comparison.
Parish: East Baton Rouge Home Renter Spending-to-Income Ratio
Parish: East Baton Rouge Home Renter Spending-to-Income Ratio
21.6%
(2024)
Compared to:
LA Parishes
The distribution is based on data from 64 Louisiana Parishes.
U.S. Counties
The distribution is based on data from 3,141 U.S. counties and county equivalents.
LA Value
(19.4%)
The regional value is compared to the Louisiana State value.
US Value
(17.7%)
The regional value is compared to the national value.
Prior Value
(19.4%)
Prior Value compares a measured value with the previously measured value. Confidence intervals were not taken into account in determining the direction of the comparison.
Parish: East Baton Rouge Homeowner Spending-to-Income Ratio
Parish: East Baton Rouge Homeowner Spending-to-Income Ratio
16.5%
(2024)
Compared to:
LA Parishes
The distribution is based on data from 64 Louisiana Parishes.
U.S. Counties
The distribution is based on data from 3,141 U.S. counties and county equivalents.
LA Value
(14.4%)
The regional value is compared to the Louisiana State value.
US Value
(14.0%)
The regional value is compared to the national value.
Prior Value
(14.8%)
Prior Value compares a measured value with the previously measured value. Confidence intervals were not taken into account in determining the direction of the comparison.
Parish: East Baton Rouge Utilities Spending-to-Income Ratio
Parish: East Baton Rouge Utilities Spending-to-Income Ratio
7.7%
(2024)
Compared to:
LA Parishes
The distribution is based on data from 64 Louisiana Parishes.
U.S. Counties
The distribution is based on data from 3,141 U.S. counties and county equivalents.
LA Value
(7.5%)
The regional value is compared to the Louisiana State value.
US Value
(5.8%)
The regional value is compared to the national value.
Prior Value
(6.9%)
Prior Value compares a measured value with the previously measured value. Confidence intervals were not taken into account in determining the direction of the comparison.
Parish: East Baton Rouge
Education / Childcare & Early Childhood Education
Value
Compared to:
Parish: East Baton Rouge Day Care Center and Preschool Spending-to-Income Ratio
Parish: East Baton Rouge Day Care Center and Preschool Spending-to-Income Ratio
10.1%
(2024)
Compared to:
LA Parishes
The distribution is based on data from 64 Louisiana Parishes.
U.S. Counties
The distribution is based on data from 3,141 U.S. counties and county equivalents.
LA Value
(8.9%)
The regional value is compared to the Louisiana State value.
US Value
(7.4%)
The regional value is compared to the national value.
Prior Value
(9.1%)
Prior Value compares a measured value with the previously measured value. Confidence intervals were not taken into account in determining the direction of the comparison.
Parish: East Baton Rouge Home Child Care Spending-to-Income Ratio
Parish: East Baton Rouge Home Child Care Spending-to-Income Ratio
4.3%
(2024)
Compared to:
LA Parishes
The distribution is based on data from 64 Louisiana Parishes.
U.S. Counties
The distribution is based on data from 3,141 U.S. counties and county equivalents.
LA Value
(4.1%)
The regional value is compared to the Louisiana State value.
US Value
(3.4%)
The regional value is compared to the national value.
Prior Value
(3.8%)
Prior Value compares a measured value with the previously measured value. Confidence intervals were not taken into account in determining the direction of the comparison.
Parish: East Baton Rouge
Education / Educational Attainment
Value
Compared to:
Parish: East Baton Rouge College Tuition Spending-to-Income Ratio
Parish: East Baton Rouge College Tuition Spending-to-Income Ratio
15.0%
(2024)
Compared to:
LA Parishes
The distribution is based on data from 64 Louisiana Parishes.
U.S. Counties
The distribution is based on data from 3,141 U.S. counties and county equivalents.
LA Value
(13.5%)
The regional value is compared to the Louisiana State value.
US Value
(12.4%)
The regional value is compared to the national value.
Prior Value
(13.4%)
Prior Value compares a measured value with the previously measured value. Confidence intervals were not taken into account in determining the direction of the comparison.
Parish: East Baton Rouge Community Spending on Education
Parish: East Baton Rouge Community Spending on Education
2.2%
(2024)
Compared to:
LA Value
(1.9%)
The regional value is compared to the Louisiana State value.
US Value
(2.4%)
The regional value is compared to the national value.
Prior Value
(2.2%)
Prior Value compares a measured value with the previously measured value. Confidence intervals were not taken into account in determining the direction of the comparison.
Parish: East Baton Rouge Student Loan Spending-to-Income Ratio
Parish: East Baton Rouge Student Loan Spending-to-Income Ratio
7.4%
(2024)
Compared to:
LA Parishes
The distribution is based on data from 64 Louisiana Parishes.
U.S. Counties
The distribution is based on data from 3,141 U.S. counties and county equivalents.
LA Value
(6.9%)
The regional value is compared to the Louisiana State value.
US Value
(4.7%)
The regional value is compared to the national value.
Prior Value
(6.6%)
Prior Value compares a measured value with the previously measured value. Confidence intervals were not taken into account in determining the direction of the comparison.
Parish: East Baton Rouge Vocational, Technical, and Other School Tuition Spending-to-Income Ratio
Parish: East Baton Rouge Vocational, Technical, and Other School Tuition Spending-to-Income Ratio
2.1%
(2024)
Compared to:
LA Parishes
The distribution is based on data from 64 Louisiana Parishes.
U.S. Counties
The distribution is based on data from 3,141 U.S. counties and county equivalents.
LA Value
(2.1%)
The regional value is compared to the Louisiana State value.
US Value
(1.6%)
The regional value is compared to the national value.
Prior Value
(1.9%)
Prior Value compares a measured value with the previously measured value. Confidence intervals were not taken into account in determining the direction of the comparison.
